To trace function select function and click the button
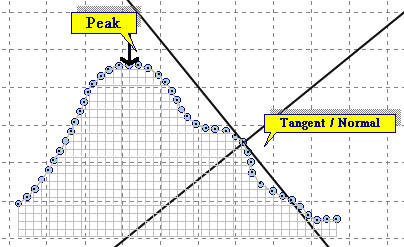
You can further analyze X, Y data, functions and fit results. Evaluation option includes function, derivatives, table generation, and extremes. You can numerically integrate the active data plot from a baseline of zero using the trapezoidal rule.

To trace data select plot and click the button
![]() or select menu item <Analysis><Trace Data>.
or select menu item <Analysis><Trace Data>.
To trace function select function and click the button
![]() or select menu item <Analysis><Trace Function>.
or select menu item <Analysis><Trace Function>.
á